
Since the founding of the company, Groundfloor has provided an opportunity for individual investors to participate directly in over 2,700 distinct real estate development projects via the securities we offer on our platform (limited recourse obligations, or LROs). Investors have committed about $450 million in investment to these projects, and to date, those investors have seen nearly $300 million of their invested principal repaid to them, along with over $20 million in interest. Investors have achieved a return on their investment of nearly 10%, and loss situations have been limited to well less than 1% of principal invested.
Because we believe in the right of investors to have full agency in determining the contents of their portfolios, the LROs we offer on our platform are designed to allow investors to select the investments that make sense for them, given their individual preferences and risk-return calculations. As an aid to that selection process, Groundfloor has developed a systematic grading algorithm that summarizes each LRO’s overall risk profile by assigning a letter grade to the LRO. Grades range from A (lowest risk) to G (highest risk) and reflect an assessment of relative risk based on a variety of factors, such as borrower experience, skin-in-the-game, and more.
We know, because investors have told us, that many investors rely heavily on these grades in making their investment decisions. We want to honor that trust by updating our investors on how LROs of different grades have performed in practice. Many investors have reached out to request this analysis, and we thank them for the request and hope this information will be useful in informing their investment decisions.
So, how have LROs of different grades performed? We will address that question here by looking at performance in three different ways:
1. Realized rates of return
2. Loss ratios
3. Performance states of the underlying loans at the time of repayment
(As we have done in a previous analysis, this study looks at loans that were originated on or after July 1, 2016. Loans from before that date were originated in the early years of our company, under a different set of underwriting and asset management standards, and are not representative of loans originated more recently. All loans from that early period have long since been resolved. If you’re interested, we invite you to learn more about the performance of loans originated prior to July 1, 2016 in our previous publication on the topic.)
Realized Rates of Return by Grade
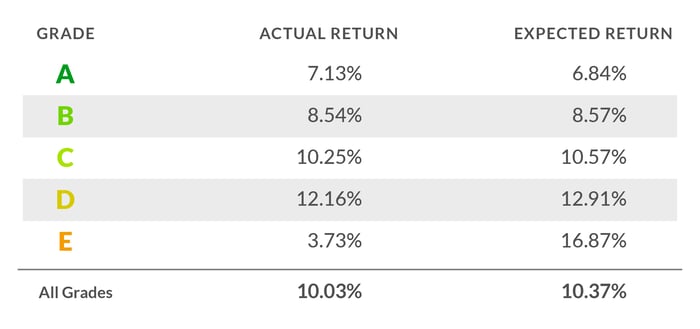
We look first at the weighted average rates of return on repaid LROs in each grade, and for comparison, the weighted average “expected” return based on the contractual interest rates on the underlying loans.
The actual rate of return paid to investors can, and often does, differ from the contractual interest rate for a number of reasons. A loan repaid from an extended or default state may be assessed a higher rate of interest, which is then passed through to investors. Alternatively, our asset management team may negotiate a reduced interest rate with a borrower based on the unique circumstances of a project, with the objective of maximizing the return for investors. Or, the actual rate on a repayment may differ from the contract rate as a result of rounding (we always round up in favor of our investors). As always, keep in mind that these rates are annualized (ie., what you’d earn over exactly 12 months) and that you accrue interest based on the amount of time your money is active in a given loan.
.png?width=700&name=loan_performance_01_02%20(1).png) As expected, lower-graded LROs have on average resulted in higher returns, commensurate with their higher risk. LROs of grade C, for example, have returned a weighted average return of 10.25% to investors, while LROs of grade B have returned 8.54%. An exception to that rule is LROs of grade E, where our actual return rate of 3.73% has fallen well short of the expected 16.87%. As represented in the figure above, though, that metric suffers from a small sample size, as we originate far fewer E-rated loans than loans of other grades. (7 LROs of grade E have been repaid and are considered in this analysis, compared to 919 LROs in grade C, for example.) We expect that this metric will continue to stabilize and produce a better reading on grade E as more data become available.
As expected, lower-graded LROs have on average resulted in higher returns, commensurate with their higher risk. LROs of grade C, for example, have returned a weighted average return of 10.25% to investors, while LROs of grade B have returned 8.54%. An exception to that rule is LROs of grade E, where our actual return rate of 3.73% has fallen well short of the expected 16.87%. As represented in the figure above, though, that metric suffers from a small sample size, as we originate far fewer E-rated loans than loans of other grades. (7 LROs of grade E have been repaid and are considered in this analysis, compared to 919 LROs in grade C, for example.) We expect that this metric will continue to stabilize and produce a better reading on grade E as more data become available.
Loss Ratios by Grade
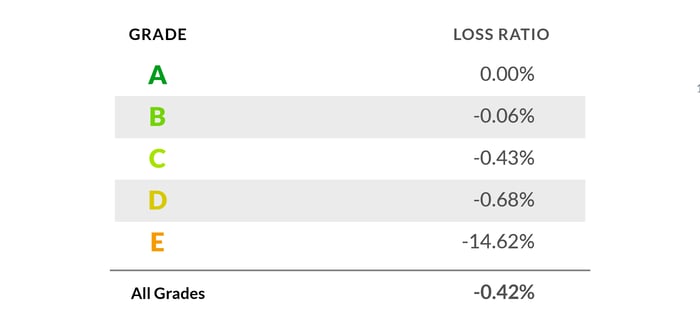
Next we consider the performance of LROs by grade in terms of their loss ratios, or the total principal lost as a percentage of total principal invested.
Loss situations most commonly occur in the context of a foreclosure, in which Groundfloor exercises its right to take possession of the collateral, then sells the property and repays investors in the LRO from the sale proceeds. A $100 investment resulting in a repayment of $95, without interest, would be considered to have a loss ratio of -5%.
.png?width=700&name=loan_performance_01_03%20(1).png) The observed loss ratios on LROs by grade are consistent with what we would expect: LROs of lower letter grades have experienced somewhat higher loss ratios compared to LROs of higher letter grades. On average, though, the loss ratio on the total population of repaid LROs is still well below 1% (coming in at -0.42%). LROs of grade E are again an outlier, showing a significantly higher loss ratio of -14.62%; but as discussed above, this metric suffers from a small sample size, and we expect it will stabilize as more data become available.
The observed loss ratios on LROs by grade are consistent with what we would expect: LROs of lower letter grades have experienced somewhat higher loss ratios compared to LROs of higher letter grades. On average, though, the loss ratio on the total population of repaid LROs is still well below 1% (coming in at -0.42%). LROs of grade E are again an outlier, showing a significantly higher loss ratio of -14.62%; but as discussed above, this metric suffers from a small sample size, and we expect it will stabilize as more data become available.
Performance States at Repayment by Grade
Finally, we analyze performance by LRO grade by looking at the “performance states” of the underlying loans at the time the LROs were repaid - current, extended, or default. (You can consult our most recently published Portfolio Analysis for a deeper discussion of these performance states.)
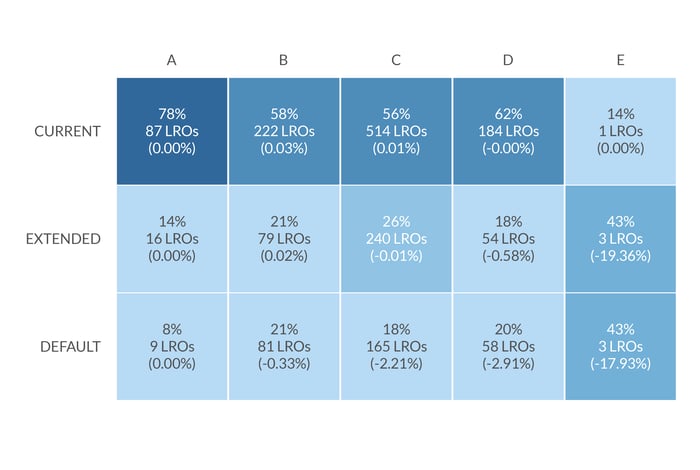 Comparing grade A to grade C in the table above, for example, we find 78% of repaid LROs of grade A were current at the time of repayment (on time, and without any default conditions triggered), compared to 56% of grade-C LROs. Similarly, 8% of grade-A LROs repaid from a defaulted state, while 18% of grade-C LROs repaid out of default.
As our experienced investors know, the movement of an LRO into an extended or defaulted state does not necessarily imply that a loss is imminent, and sometimes can even result in a better interest return (through the assessment of a higher, penalty interest rate). Loss ratios for each category are presented in parentheses in the figure above; as you’ll note, the 9 grade-A LROs that repaid out of a defaulted state did not result in any loss of principal, while the 165 grade-C LROs that repaid out of default resulted in a loss ratio of -2.21%. These figures illustrate something important about our product: our loans are well collateralized, and are designed to perform for our investors and limit losses, even in situations where borrowers default.
Conclusion
We hope this discussion has been illuminating and will continue to inform your future investment decisions. Investors who wish to develop and execute their own approach to investing on our platform should be equipped with the information they need to do so, and this analysis was prepared in that spirit. At the same time, investors who wish to invest in Groundfloor loans more passively can use our Automatic Investing feature to set an investment strategy defined by LRO grade, and let our algorithm automatically reinvest repaid funds into new LROs in accordance with the strategy. Or, investors can use our Investment Wizard to automatically allocate funds into a basket of available LROs that are within their risk tolerance, without having to pick and choose themselves. However you decide to build your portfolio, we strive to give you the tools and information you need to achieve your investing goals.
Questions or comments? Get in touch by commenting below, or reach out to us at support@groundfloor.us. We always appreciate hearing from you.
