

As investors on our platform know, we assign letter grades to the loans we offer up for funding to help investors easily assess their relative risk level at a glance. These letter grades range from A (least risk) to G (most risk) and are assigned based on factors such as the borrower’s experience and the details of the proposed project. Many investors therefore rely heavily on these grades to make informed decisions about which projects to invest in. But how do loans in each grade tend to perform?
In the past, we have completed a number of different analyses of our loans’ performance, including a study of the range of returns realized in investors’ portfolios and a comparison of the current outstanding loan portfolio to historical figures; but we have never completed an analysis of loan performance broken out by letter grade. In response to the many suggestions for such a study, today we are proud to present our analysis of loan performance by grade.
First, a quick note: investors who have been with Groundfloor since the beginning will remember that we made significant improvements to our underwriting and asset management standards after 2016, and that therefore we have divided our loans along that line into two distinct loan vintages. Vintage A is composed of 88 relatively small, mostly local Atlanta-area loans originated during Groundfloor's formative years, a period of 30 months (2.5 years). Vintage B, by contrast, is composed of loans we originated following our addition and application of greater lending expertise. As of February 6, 2020, Vintage B includes 706 loans.
For more information about our loan vintages, please refer to our original loan vintage analysis.
Now, let’s dive into our loan grade analysis in earnest.
Returns Realized by Grade
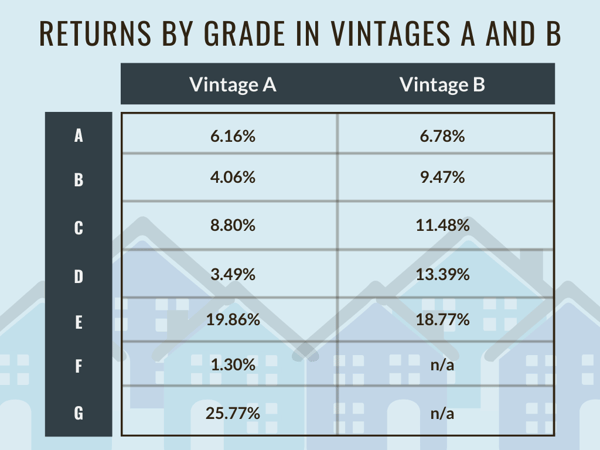
We first took a look at the returns realized across each loan grade for Vintages A and B. Remember, Vintage A is composed of 88 loans originated during the first couple of years of Groundfloor's existence (2013 through June 2016), while Vintage B is made up of all loans originated after the application of more rigorous underwriting and risk management standards in July 2016. This analysis calculates Vintage B as being composed of 706 loans originated since July 2016 (data as of 2/6/2020).
Loss Ratios by Grade
Next, we looked at losses realized across loan grades in Vintages A and B. As a reminder, we express losses in terms of a loss ratio, which is the amount of principal lost divided by the principal invested. This method of assessing loss tends to be more accurate to the true losses investors on our platform are seeing because it looks at loss in terms of the actual dollar amount of principal lost as a function of total principal invested. If we instead chose to look at unit volume of loans with loss versus total loans, some nuances (such as if a loan experiences only a partial loss of principal) would be lost.
This metric is also much more precise to assess losses on our platform than the default rate, as loans falling into default do not necessarily indicate that there will be a principal loss; in fact, defaults typically result in a return, often more than expected. To learn more about how this is possible, please refer to our blog post on our Asset Management processes. Looking at losses in terms of the actual dollar amount of principal lost as a percentage of total principal invested is thus a much more accurate measure of the actual losses investors are experiencing.
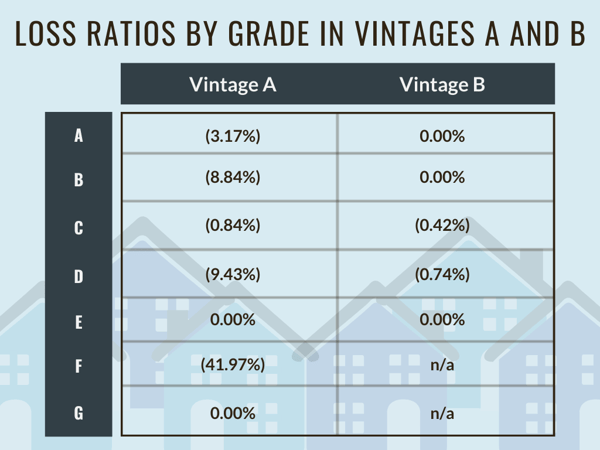
As can be seen from the charts above, Vintage A experienced lower returns and higher loss ratios across grades than did Vintage B, further highlighting the difference that improving our lending and asset management standards made on our loan portfolio. Not only did loans in Vintage B earn higher returns across each different letter grade, the loss ratios in each grade also dropped significantly. Vintage B’s metrics perfectly showcase the general trade-off in risk vs. reward as you descend letter grades. A-grade loans generally yield the lowest returns but have correspondingly low risk, while D-grade loans give you a bigger return for the increased risk you assume.
Loan Performance By Grade
We then examined the performance state by grade within each vintage to see how loans in each grade category tend to perform. Unlike with the loss ratio described above, the percentage calculated here is based upon loan count, i.e., what percentage of the total number of loans in that grade fell into each performance state.
We categorized loans as falling into one of three categories upon repayment:
- Current - loan remained current throughout the term and repaid with full principal (plus interest)
- Workout/Default - one or more default events occurred, but a workout plan was put into effect and the loan returned full principal (plus interest)
- Principal Loss - one or more default events occurred and the loan experienced some degree of principal loss
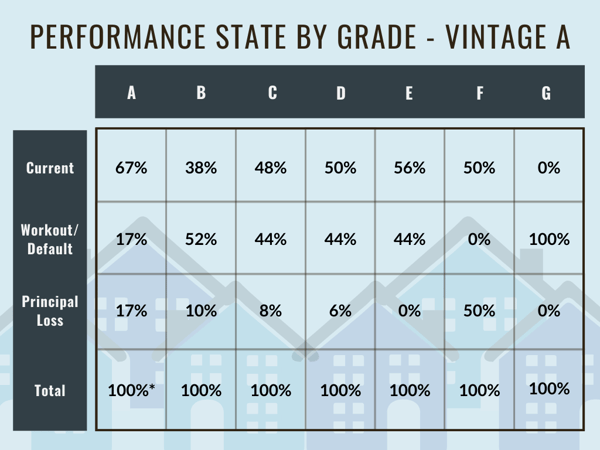 * Adding up the percentages in this column actually yields a total of 101%, which is due to us rounding the percentages off to whole numbers.
 * Again, the discrepancy here is due to us rounding off the percentages to whole numbers.
Comparing the metrics calculated for loans in Vintage A versus Vintage B clearly shows the impact that adjusting our lending and asset management standards had on loan performance. In Vintage A, principal loss occurred across virtually every grade category, while on-time repayments of principal hovered around only about half of loans in each grade (a notable exception were A-grade loans, which repaid on time roughly three-quarters of the time).
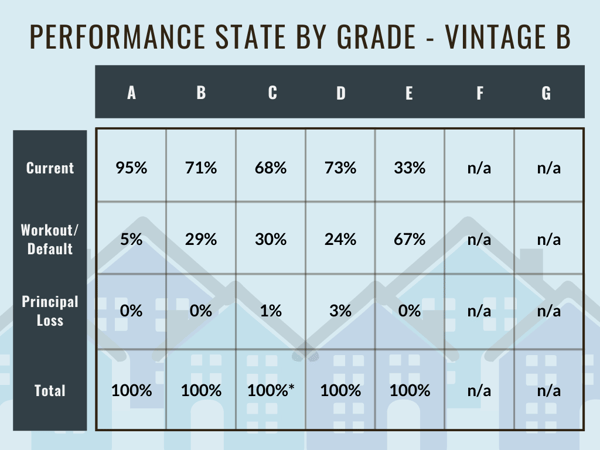
Vintage B, however, tells a different story. Thanks to the adoption of more rigorous lending practices, principal loss across all grades dropped dramatically, with the highest percentage of loans losing principal capping out at just 3%. The percentage of current loans also rose across the board, with 68% or more of loans repaying on time and in full, regardless of grade.1 Additionally, the rate of loans subject to workout fell across each letter grade in Vintage B as opposed to Vintage A,2 a further indication that our more robust asset management standards are continuing to pay off for investors.
Finally, Vintage B more accurately reflects the relationship between assumed risk and potential returns. A-grade loans (loans with the lowest inherent risk) tend to perform the best (i.e., remain current through repayment), with the potential for principal loss increasing as we move into higher-risk letter grades. This corresponds to what we saw when analyzing the returns and loss ratios for Vintage B loans: as you go down in letter grade, the loss ratio increases in accordance with the increased level of risk you are taking on.
1 This does not hold true for E-grade loans in Vintage B; however, because this loan grade category only includes three loans total, we do not consider this to represent a general trend.
2 Again, this is not true for the E-grade loans, but we are disregarding these per the above note.
We hope the above discussion has helped illuminate the performance of our loans by letter grade, and we’d like to thank everyone that reached out to suggest this kind of analysis. We strive to give investors as much information as possible to empower them to develop and execute their own investment strategies. As we continue to move through 2020, we hope to publish more analyses that examine other factors that could be affecting investment performance. If you have suggestions for such analyses (or if you have questions about this one), we want to hear them. Feel free to leave a comment below, or email us directly at support@groundfloor.us. We always appreciate hearing from you.
