Last August, we published our updated diversification analysis on the range of returns realized in the portfolios of over 6,900 Groundfloor investors up until that time. We’ve updated and enhanced that analysis for our sixth edition. The data now includes 9,094 portfolios, with 1,098 loans repaid representing $159M in principal invested. As we wrote in our original diversification analysis published in July 2017:
As many readers know, diversification is a risk management technique that mixes a wide variety of investments within a portfolio. When properly diversified, a portfolio should yield higher returns and lower risk more reliably than will a single investment or a small number of concentrated investments held in a similar portfolio. Diversification is a strategy intended to negate risk events that are unique to any particular investment in a portfolio. With diversification, the negative performance of some investments is expected to be countered by the positive performance of others.
This technique is even more relevant given the current uncertainty in financial markets due to the COVID-19 pandemic. We recently performed an extensive stress test analysis on our outstanding loan portfolio to analyze the impact of potential adverse changes in the real estate market on our investors’ portfolios. The results showed that even in a worst-case scenario akin to the housing crisis of 2008, investors who are well-diversified will be better positioned to weather times of economic dislocation and contraction.
The Effects of Diversification on Portfolio Returns
Our updated analysis shows how investors’ portfolios have performed overall since Groundfloor first started offering investments over six years ago. As a refresher, or for those readers not familiar with the previous five editions (August 2019, December 2018, July 2018, January 2018, and July 2017), the chart shows the relationship between the number of loans held and the average returns realized for investor portfolios on our platform. Each dot represents an anonymous individual investor portfolio containing x number of loans (plotted along the x-axis) that has realized a given annualized rate of return y (plotted along the y-axis).
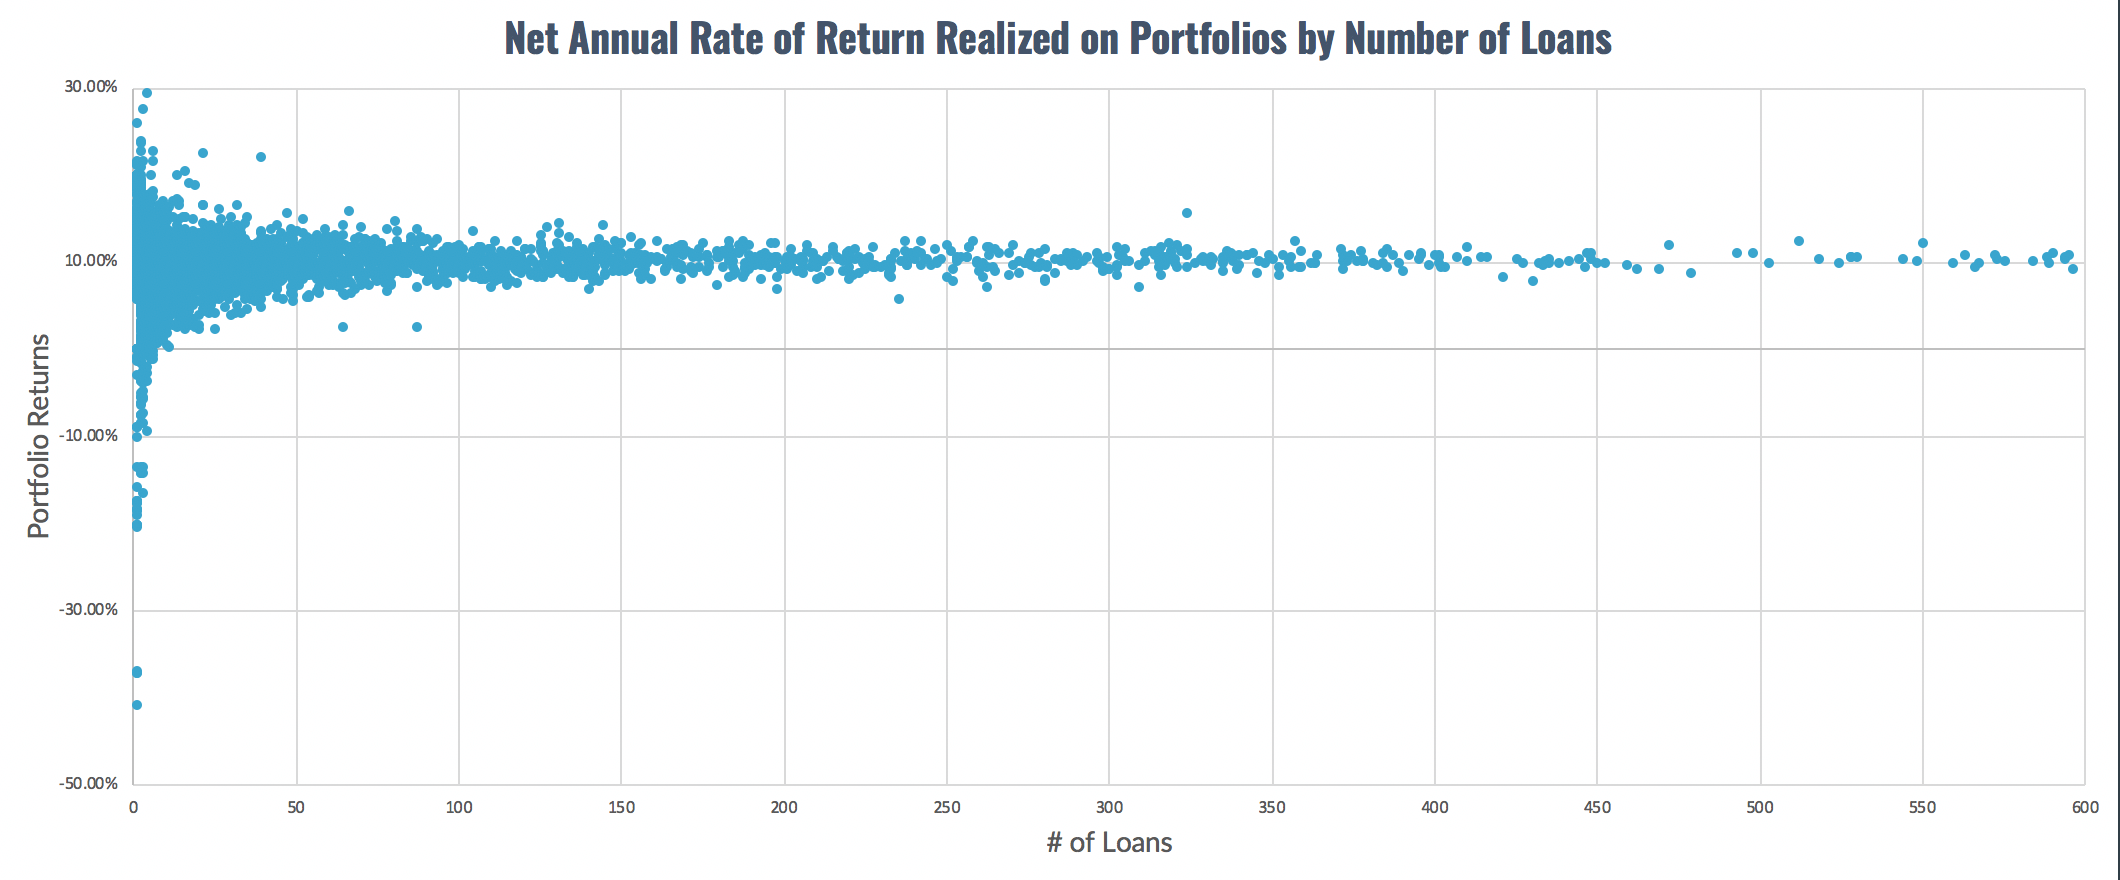
Our analysis shows that a hypothetical model portfolio composed of an equal investment made in all 1,098 loans repaid to date would have earned an annualized net return of 10.50%. This rate of return is in line with our current outstanding portfolio’s expected contract rate of 10.3%, as we discuss in our stress test analysis post.
For this analysis, we maintained the same method of calculating portfolio returns as we employed previously. As we described it in our original edition of the analysis:
We calculate portfolio returns by dividing the amount of interest earned for each investment by the amount of principal invested, and then annualizing that figure. Each annualized return is then weighted by the amount invested as a proportion of all principal invested in the portfolio. Reinvestments are accounted for as new, separate investments. Balances held as available cash in Groundfloor Accounts are not included in the analysis, since they are not invested and can be withdrawn upon demand.
Once again, as the theory of diversification predicts, portfolios invested in the largest number of loans realized the most reliable returns. This is true even though Groundfloor investors, unlike investors in REITs or other funds, decide not only which loans to include in their portfolios, but how much capital to allocate to each loan, relative to the others. The power of diversification is that strong -- and Groundfloor investors are achieving a greater level of it than is provided by competing online REIT products.
The Effects of Diversification on Loss Ratios
The portfolio returns reported above are reported net of losses. This means losses are taken into account in calculating the return presented. Many investors want to understand not only the net rate of return, but also the level of losses they can expect when investing to get to that net return. The measure of losses is known as the “loss ratio.”
As we explained in our original analysis:
The “loss ratio” is the amount of principal lost expressed as a ratio to the principal invested. A loss ratio of -5.0%, for example, would mean that $50 was lost out of every $1,000 invested. Similar to the rate of return chart, the chart below illustrates loss ratios realized by individual portfolios compared by the number of loans held in each portfolio.
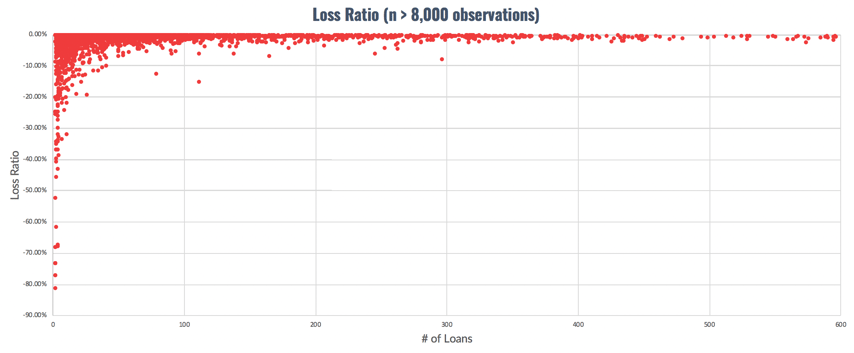
A model portfolio composed of equal investments in all 1,098 loans repaid to date would have experienced a loss ratio of -0.72%. With an additional 427 loans repaid since the last analysis, the loss ratio is still less than 1% -- just as it has been for the last six years.
The steady returns our investment products provide -- and the relative liquidity of these returns over the short term -- is especially comforting in such uncertain times as those we’re currently experiencing. As we wrote in Our Perspective on Market Volatility in February, we continue to believe that investors holding private market loans backed by residential real estate at low leverage have a competitive advantage in weathering the COVID-19 storm and potential for continued repricing of public and private market assets.
Over six years ago, Groundfloor was founded to enable everyday Americans to invest in high-yield securities previously reserved for the top 5% of wealth holders and income earners. As Groundfloor continues to expand its loan origination capabilities, the extent to which our investors can diversify their portfolios has reached levels that are unprecedented in the real estate investment space. In line with our mission, we will continue to empower our investors to develop and execute their own investment strategies, while our $10 per project minimum investment size ensures diversification is always possible. Whether and how you take full advantage of this degree of freedom is up to you.
We share this kind of information to help support our investors’ success. If you have any questions or comments about this report, do not hesitate to reach out to us. You can comment below or send an email to support@groundfloor.us. We always appreciate hearing from you.