
Last July, we published our updated diversification analysis on the range of returns realized in the portfolios of over 3,300 GROUNDFLOOR investors up until that time. We’ve updated and enhanced that analysis for our fourth edition to start off the new year. The data now includes 4,732 portfolios, with over 420 loans repaid representing $48,713,522 in principal invested. The scale has increased from 3,330 portfolios, over 312 loans repaid and $33,776,232 in principal invested in our July 2018 analysis.
As we wrote in our original diversification analysis published in July 2017:
As many readers know, diversification is a risk management technique that mixes a wide variety of investments within a portfolio. When properly diversified, a portfolio should yield higher returns and lower risk more reliably than will a single investment or small number of concentrated investments held in a similar portfolio. Diversification is a strategy intended to negate risk events that are unique to any particular investment in a portfolio. With diversification, the negative performance of some investments is expected to be countered by the positive performance of others.
The Effects of Diversification on Portfolio Returns
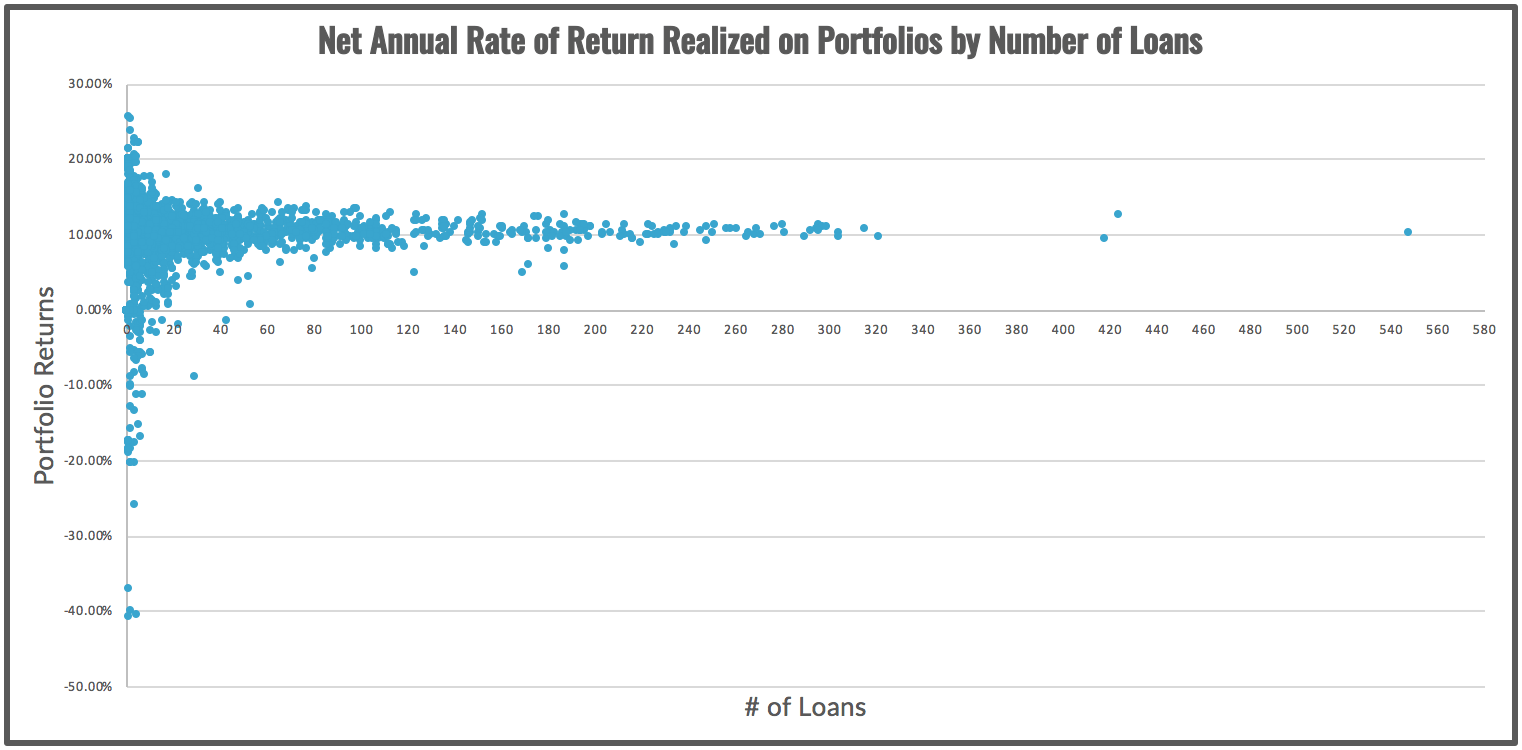
Our updated analysis shows how investors’ portfolios have performed overall in the five years since GROUNDFLOOR first started offering its investments. As a refresher, or for those readers not familiar with the previous three editions (July 2018, January 2018, and July 2017), the chart shows the relationship between portfolio returns realized and the number of loans held in each portfolio. Each dot represents an anonymous individual investor portfolio containing a number of loans (plotted along the x-axis) that has realized a given annualized rate of return (plotted along the y-axis).
Our analysis shows that a hypothetical model portfolio composed of an equal investment made in all 421 loans repaid to date would've earned an annualized net return of 10.72%.
This is somewhat lower than the 11.39% model annualized net return calculated in our previous diversification analysis because the loans originated and repaid since that analysis was published have been relatively lower-yield loans overall (9.4% average return vs. 11.0% average return).
Net Annual Rate of Return Realized on Portfolios by Number of Loans
For this analysis, we maintained the same method of calculating portfolio returns as we employed previously. As we described it in our original edition of the analysis:
We calculate portfolio returns by dividing the amount of interest earned for each investment by the amount of principal invested, and then annualizing that figure. Each annualized return is then weighted by the amount invested as a proportion of all principal invested in the portfolio. Reinvestments are accounted for as new, separate investments. Balances held as available cash in GROUNDFLOOR Accounts are not included in the analysis, since they are not invested and can be withdrawn upon demand.
Once again, as the theory of diversification predicts, portfolios invested in the largest number of loans realized the most reliable returns. This is true even though GROUNDFLOOR investors, unlike investors in REITs or other funds, decide not only which loans to include in their portfolios, but how much capital to allocate to each loan, relative to the others. The power of diversification is that strong -- and GROUNDFLOOR investors are achieving a greater level of it than is provided by competing online REIT products.
This chart also shows the risk of not diversifying one’s investments. A small number of portfolios at the extremes put all their eggs in a few baskets. Portfolios containing only a handful of loans or less realized a wide variety of returns, including some significant losses for those who bet big on our one high-yield (23.8%) F-grade loan that was originated in December 2015 and ended up losing principal when it was resolved in July 2017.
The Effect of Diversification on Loss Ratios
The portfolio returns reported above are reported net of losses. This means losses are taken into account in calculating the return presented. Many investors want to understand not only the net return figure, but also the losses they can expect when investing to get to that net return. The measure of losses is known as the “loss ratio.”
As we explained in our original analysis:
The “loss ratio” is the amount of principal lost expressed as a ratio to the principal invested. A loss ratio of -0.05, for example, would mean that $50 was lost out of every $1,000 invested. Similar to the rate of return chart, the chart below illustrates loss ratios realized by individual portfolios compared by the number of loans held in each portfolio.
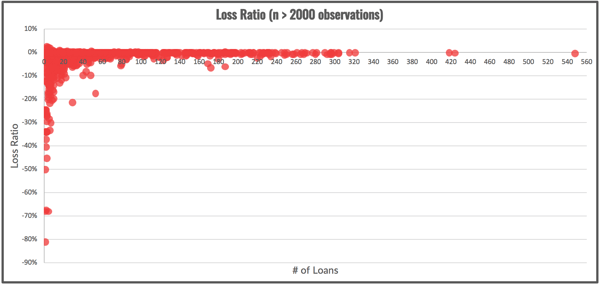
Loss Ratios Realized in Portfolios by Number of Loans
A model portfolio composed of equal investments in all 421 loans repaid to date would've experienced a loss ratio of -0.0037 (in percentage terms: -0.37%).
This loss ratio is approximately the same as the -0.35% we reported in our previous diversification analysis of July 2018. This result demonstrates that we are continuing to employ the same rigorous standards to our underwriting and asset management practices to try to mitigate loss as much as possible.
Additionally, it’s worth noting that all but one of the loans with principal losses were originated earlier in GROUNDFLOOR’s lifetime, during Vintage 1 (before July 2016); these loans are affecting this current diversification analysis because they have only recently been collected. Since that vintage, we have made significant improvements to our asset management and underwriting procedures. Those improvements have made a big difference for our investors. Going forward, we expect future loss ratios to improve, reflecting the effect of this more rigorous application of our standards.
To read more about our loan vintages, please check out our latest loan vintage analysis.
To learn more about how our asset management processes have improved over time, please refer to our blog post on managing risk.
The reduction of loss ratios benefits everyone. It’s a virtuous cycle. The lower the loss ratio realized over time (currently 0.37%), the more certain investors can be of realizing their expected returns (10.72% net). The more certain we are of realizing investor returns, the lower rates we can then start offering our borrowers. That, in turn, helps us to originate more loans while holding quality constant or improving it.
Loan Status At Resolution
In response to feedback from our original analysis, starting in January of 2018 we also provided additional data to help investors assess where future performance might net out. Actual investment experience cannot guarantee future performance, but it can provide insight to potential return scenarios.
Previous analyses provided a historical loss ratio for loans in Workout and Default states. In this edition, as in the July 2018 edition, we’ve improved upon that to add a full stratification of repaid loans by performance state:
-
Current - loan remained current through the term,
-
Default - loan was put into default, but did not advance beyond that state,
-
Workout - a workout plan was put into effect and the loan was resolved under the terms of the workout agreement, and
-
REO - GROUNDFLOOR assumed title to the property (either through foreclosure or deed in lieu) and sold the property.
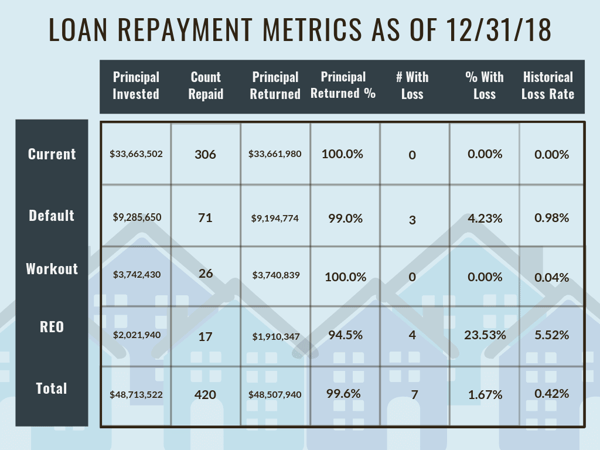
The table shows that loans falling into REO status experience the highest loss rate, at 5.52%. This was based on 17 loans repaid from that state, four of which took losses. Note that our overall loss rate reported in the table above (0.42%) differs slightly from the loss ratio realized by investors (0.37%). This difference is due to the arithmetic of weighting by loan size in the former case, compared to equal weighting (assuming the same size investment in all loans) in the latter. Losses in larger loans have a correspondingly larger impact in the former method. Empirically, the median investment size does not appear to vary by loan size, so for most investors the latter method will be more instructive.
Reaching beyond repaid loans, overall there are currently 325 loans totaling $54,231,810 outstanding. A similar stratification of the active portfolio yields the following:
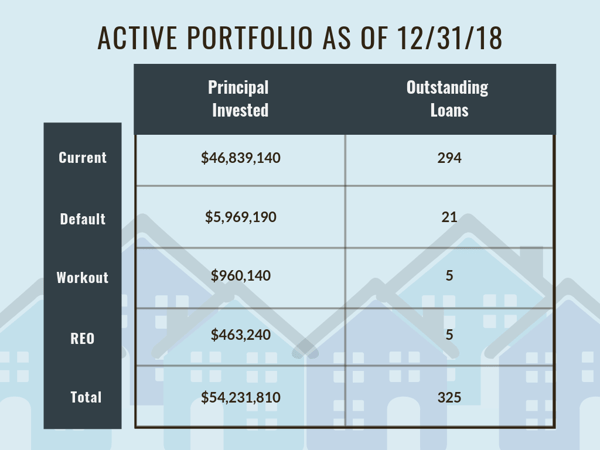
While the final performance of the outstanding book has yet to be determined, we can measure how it currently stands relative to the repaid portfolio. Significantly, 72.8% of the repaid loan volume was current at repayment while 90.4% of the outstanding book is current. That is a significant improvement in underwriting and asset management performance. Similarly, 16.9% of repaid loans were in default, while the current book has 6.5% of loans in default.
Looking at the outstanding book, the ratio of loans in REO to the total outstanding loans is much lower, at 5/325 or 1.54%. This drastic reduction is due to continued advances in underwriting and our efforts to restrict the origination of loans in judicial foreclosure states. We are proud to see that the data shows our efforts are paying off, which translates to a better overall experience for our borrowers and investors.
Over six years ago, GROUNDFLOOR was founded to enable everyday Americans to invest in high-yield securities previously reserved for the top 5% of wealth holders and income earners. As GROUNDFLOOR continues to expand its loan origination capabilities, the degrees to which our investors can diversify their portfolios has become unprecedented in the real estate investment space. In line with our mission, we will continue to empower our investors to develop and execute their own investment strategies. Whether and how you take full advantage of this degree of freedom is up to you.
We share this kind of information to help support our investors’ success. If you have any questions or comments about this report, do not hesitate to reach out to us. You can comment below, tweet to @groundfloor_com, send us a message on our Facebook or Instagram pages, or send an email to support@groundfloor.us.
