Last December, we published our updated diversification analysis on the range of returns realized in the portfolios of over 4,700 Groundfloor investors up until that time. We’ve updated and enhanced that analysis for our fifth edition. Please note that we have deviated slightly from our usual six-month interval in order to include a group of recently resolved loans with losses as a way to more accurately reflect our performance up until this point in time. The data now includes 6,938 portfolios, with 671 loans repaid representing $85,820,044.43 in principal invested.
As we wrote in our original diversification analysis published in July 2017:
As many readers know, diversification is a risk management technique that mixes a wide variety of investments within a portfolio. When properly diversified, a portfolio should yield higher returns and lower risk more reliably than will a single investment or a small number of concentrated investments held in a similar portfolio. Diversification is a strategy intended to negate risk events that are unique to any particular investment in a portfolio. With diversification, the negative performance of some investments is expected to be countered by the positive performance of others.
The Effects of Diversification on Portfolio Returns
Our updated analysis shows how investors’ portfolios have performed overall in the five years since Groundfloor first started offering its investments. As a refresher, or for those readers not familiar with the previous four editions (December 2018, July 2018, January 2018, and July 2017), the chart shows the relationship between the number of loans held and the average returns realized for investor portfolios on our platform. Each dot represents an anonymous individual investor portfolio containing a number of loans (plotted along the x-axis) that has realized a given annualized rate of return (plotted along the y-axis).
Our analysis shows that a hypothetical model portfolio composed of an equal investment made in all 671 loans repaid to date would've earned an annualized net return of 10.68%.
This rate of return is slightly lower than the 10.72% rate of return calculated in our last diversification analysis. This is primarily due to our increase in the overall dollar amounts of our loans, as well as several projects with principal loss that just repaid this month, as mentioned at the beginning of this analysis.
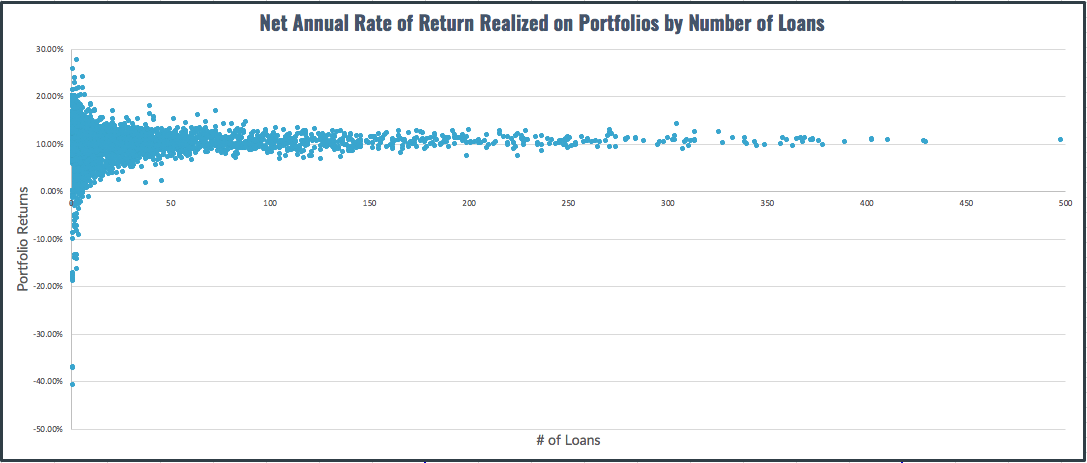
Net Annual Rate of Return Realized on Portfolios by Number of Loans
For this analysis, we maintained the same method of calculating portfolio returns as we employed previously.
As we described it in our original edition of the analysis:
We calculate portfolio returns by dividing the amount of interest earned for each investment by the amount of principal invested, and then annualizing that figure. Each annualized return is then weighted by the amount invested as a proportion of all principal invested in the portfolio. Reinvestments are accounted for as new, separate investments. Balances held as available cash in Groundfloor Accounts are not included in the analysis, since they are not invested and can be withdrawn upon demand.
Once again, as the theory of diversification predicts, portfolios invested in the largest number of loans realized the most reliable returns. This is true even though Groundfloor investors, unlike investors in REITs or other funds, decide not only which loans to include in their portfolios, but how much capital to allocate to each loan, relative to the others. The power of diversification is that strong -- and Groundfloor investors are achieving a greater level of it than is provided by competing online REIT products.
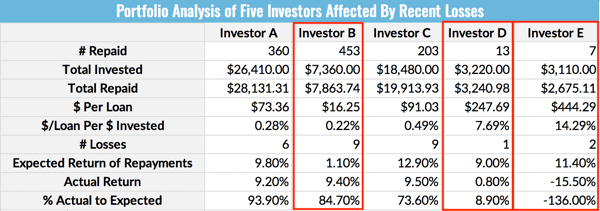
This holds true even when taking losses into consideration. Investors who have diversified their portfolios into a large number of loans still realize high rates of return, even when losses occur. To illustrate this, we analyzed the portfolios of five different investors, all of whom were affected by at least one of the two losses this month:
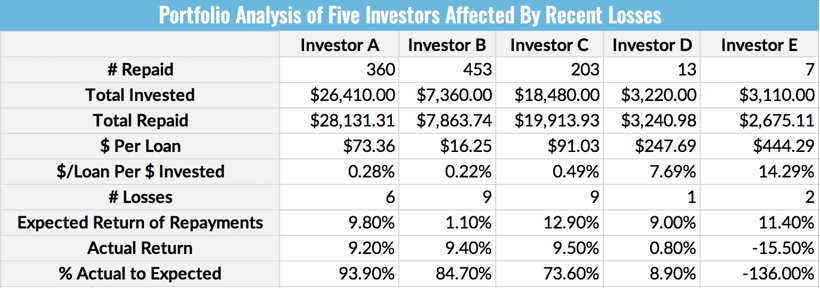
An Analysis of the Portfolios of Five Investors Affected By Recent Losses
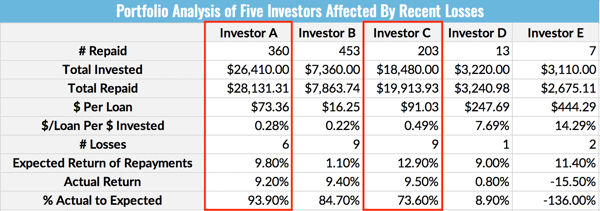
Investor A vs. Investor C
As we can see here, the theory of diversification holds true. Let’s compare Investors A and C for a good example case. Per the table, Investor A has invested slightly over $26,000, spread out over 360 LROs on our platform, averaging about $73 per LRO. Investor C has a slightly lower overall investment amount -- about $18,500 total -- spread out over 203 LROs and averaging about $91 per LRO. Both investors experienced losses in their portfolios, but the effect those losses had on their overall returns is different. Investor A experienced 6 total losses, but because his portfolio was heavily diversified, his actual returns were only 0.6% lower than his expected returns. By contrast, Investor C’s portfolio was much more heavily impacted by the 9 losses he experienced. Investor C allocated relatively more of their portfolio to higher-yield (i.e. lower grade, riskier) loans and earned returns that were 3.4% lower than expected. Though the amount of money both investors put to work on our platform was roughly equal, Investor A spread it out over more loans, at a lower amount per loan, in lower-risk loans, than did Investor C. As a result of this increased diversification, Investor A realized more reliable returns. Interestingly, Investor C still came out 0.3% ahead of Investor A, a slight advantage in return for the greater risk taken in that portfolio.
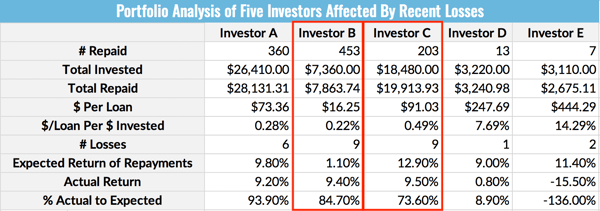
Investor B vs. Investor C
Let’s further compare Investor C to Investor B. As we can see, both investors saw 9 total losses in their portfolios. Investor B’s portfolio contains less than half of the amount of active money than that of Investor C, but Investor B has diversified his funds into over double the amount of LROs than Investor C has, at a lower average amount per LRO. Investor B also allocated their portfolio into higher-yield, higher-risk loans (expected return of 11.1%), but not as much so as did Investor C (expected return of 12.9%). As a result, Investor B’s returns were much less affected by the losses he experienced, only decreasing against the expected return by 1.7%. Once again, had Investor C further diversified his portfolio into more LROs, he may have avoided experiencing a 3.4% decrease in his actual returns. While Investor C’s outcome was riskier, they also came out on top with 0.1% more yield than Investor B earned.
Investor B vs. Investors D and E
This can be even more clearly seen when examining the cases of Investors D and E. These investors invested heavily in only a few loans -- just 13 and 7, respectively -- and as a result, the losses they experienced resulted in dramatically decreased actual returns. Even though Investors D and E experienced fewer overall losses than did the other investors in this analysis, because they invested in much fewer loans, their actual returns were much more heavily impacted. Indeed, Investor E actually realized a negative return on his investments because he spread his $3,000 over just 7 total loans, two of which ended up as losses. Had he instead spread out his funds over more loans, as did Investor B (who spread $7,000 over 453 loans), his returns would not have taken as big of a hit. The two losses Investor E experienced were devastating to his overall portfolio performance, whereas the 9 losses Investor B experienced only slightly lowered his overall returns. This is entirely due to the power of diversification.
The Effects of Diversification on Loss Ratios
The portfolio returns reported above are reported net of losses. This means losses are taken into account in calculating the return presented. Many investors want to understand not only the net return figure, but also the losses they can expect when investing to get to that net return. The measure of losses is known as the “loss ratio.”
As we explained in our original analysis:
The “loss ratio” is the amount of principal lost expressed as a ratio to the principal invested.
A loss ratio of -0.05, for example, would mean that $50 was lost out of every $1,000 invested. Similar to the rate of return chart, the chart below illustrates loss ratios realized by individual portfolios compared by the number of loans held in each portfolio.
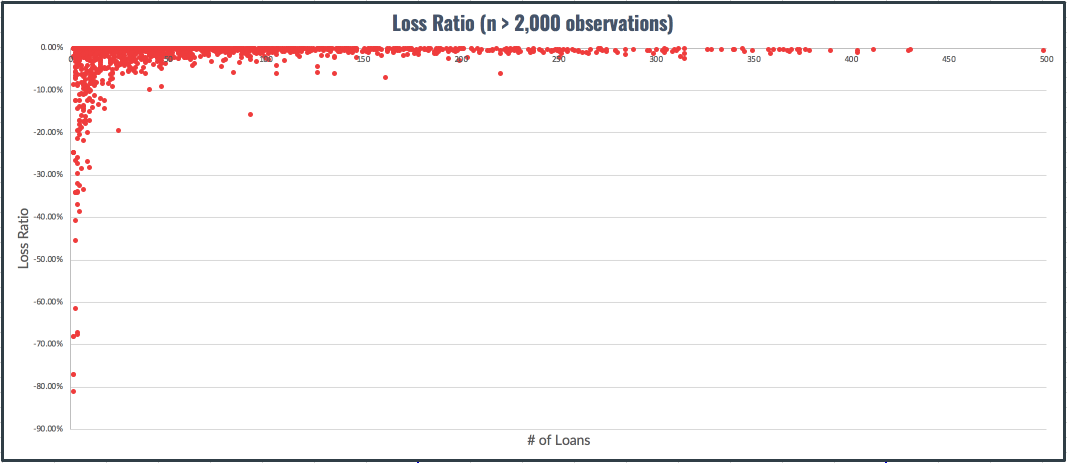
Loss Ratios Realized in Portfolios by Number of Loans
A model portfolio composed of equal investments in all 671 loans repaid to date would've experienced a loss ratio of -0.61%.
This loss ratio has increased from the -0.37% we reported in our previous diversification analysis of December 2018 primarily due to our increase in the overall dollar amounts of our loans, as well as several projects with principal loss that just repaid this month as mentioned at the beginning of this analysis.
Even with this increase in loss ratio, it’s worthwhile to note that losses on our platform are still less than 1% -- and have been for the last six years. Investors across the country are benefitting from the steady returns we provide; unlike the stock market, which can fluctuate wildly (case in point: the S&P 500 index finished down over 6% last year, but is now up over 15% this year), our real estate investment products are stable and continue to reliably deliver over 10% returns annually.
Over six years ago, Groundfloor was founded to enable everyday Americans to invest in high-yield securities previously reserved for the top 5% of wealth holders and income earners. As Groundfloor continues to expand its loan origination capabilities, the extent to which our investors can diversify their portfolios has reached levels that are unprecedented in the real estate investment space. In line with our mission, we will continue to empower our investors to develop and execute their own investment strategies. Whether and how you take full advantage of this degree of freedom is up to you.
We share this kind of information to help support our investors’ success. If you have any questions or comments about this report, do not hesitate to reach out to us. You can comment below, tweet to @groundfloor_com, send us a message on our Facebook or Instagram pages, or send an email to support@groundfloor.us.