In response to feedback from our original diversification analysis, starting in January of 2018 we also provided additional data to help investors assess where future performance might net out. Actual investment experience cannot, of course, guarantee future performance -- but it can provide insight into potential return scenarios. We analyzed the state of all repaid loans to date to view the historic relationship between performance state and repayments; then, we looked at the state of all outstanding loans in our current portfolio and compared them to our repaid loan numbers.
The Repaid Portfolio
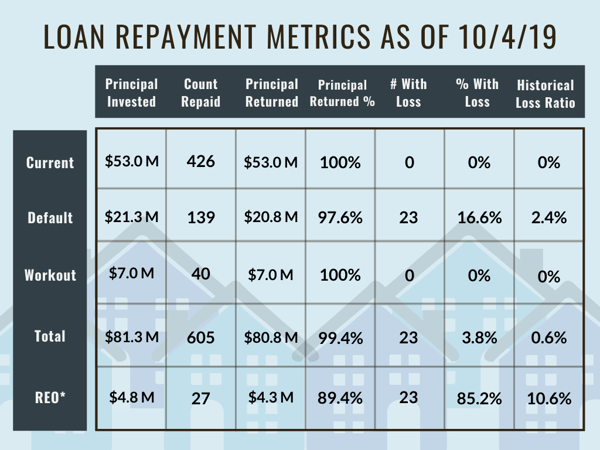
Shown below is a full stratification of all repaid loans by performance state as of October 4, 2019. As a reminder, the performance states are defined as:
Current - loan remained current through the term
Default - loan was put into default, but did not advance beyond that state (in other words, the loan was resolved while in default)
Workout - a workout plan was put into effect and the loan was resolved under the terms of the workout agreement
REO - Groundfloor assumed title to the property (either through foreclosure or deed in lieu) and sold the property.

* The loans falling into REO status are a subset of the default loans; as such, the REO data relayed here is not incorporated into the total figures because the data is already accounted for under the default data.
From the table above, we can see that loss was experienced only in loans that fell into REO status -- there were 23 loans out of a total of 27 loans (85.2%) in REO status that experienced some degree of loss. (NOTE: Though the table also seems to show 23 loans in default status that experienced loss, these are actually the same loans -- as a reminder, loans falling into REO status are a subset of the default loans.) We can also see that repaid loans in REO status realized an average loss of 10.6%. We can also calculate the ratio of funds lost to the total principal invested in loans that had a loss. This figure is slightly higher, at 15.7%.
Although this loss rate is higher than the number reported in our previous analysis, we can attribute this to several factors. Almost all loans with loss were originated prior to June 2017. We greatly strengthened our origination and asset management processes in the latter half of 2017 and the results of these improvements can be seen in the data, with fewer loans in REO and better control of defaulted loans after mid-2017.
This data set also includes the last of the loans originated in our first loan vintage (Vintage A) to be cleared from our books. These loans were originated from January 2014 to June 2016, during Groundfloor's formative years; since that time, we’ve greatly improved our lending and risk management practices by 1) hiring more talent and experience on our Operations and Asset Management teams and 2) enhancing and refining our monitoring and default resolution practices. It is to be expected, then, that losses reported would experience a jump from our previous analysis, as we have finally resolved the last of the outstanding Vintage A loans from our books.
To explore more about our lending and risk management practices, click here to read our blog post.
Although 23 of the 27 loans falling into REO status to date experienced loss, this equates to just 23 loans experiencing loss out of 605 total loans repaid to date -- in percentage terms, 3.8% of all repaid loans experienced some degree of principal loss. Additionally, three of the loans in REO status actually repaid in full and experienced no loss. Finally, we can see from the table that out of the entire repaid loan portfolio to date, the total principal that was lost comes to 0.6% of the total principal invested to date.
The Active Portfolio
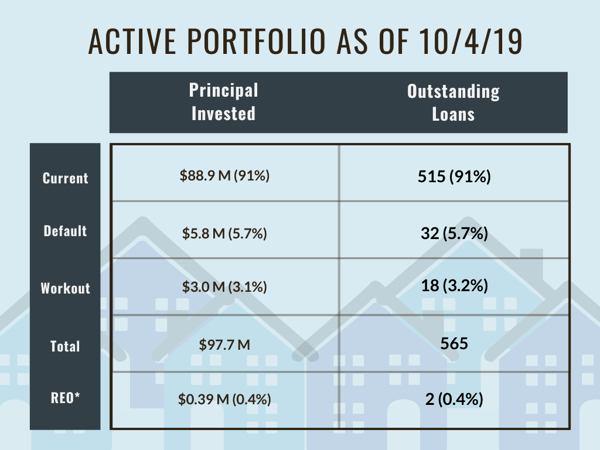
Looking beyond repaid loans, overall there are currently 565 loans totaling $97,767,570 outstanding. A similar stratification of the outstanding portfolio yields the following:

* The loans falling into REO status are a subset of the default loans; as such, the REO data relayed here is not incorporated into the total figures because the data is already accounted for under the default data.
While the final performance of the outstanding book won't be known until all loans repay, we can measure how it currently stands relative to the repaid portfolio. Significantly, 70.4% of the repaid loan volume was current at repayment, while 91.2% of the outstanding book is current. This is the result of more consistent adherence to more rigorous underwriting and asset management standards, as well as a greater emphasis on proactive monitoring. Similarly, 23.0% of repaid loan volumes were in default, while the current book has just 5.7% of loans in default. This figure compares favorably to previously measured default rates. For example, in February 2018, the default rate on the outstanding book was approximately 14%, whereas today it stands at just under 6%. Looking at the outstanding book, the ratio of loans in REO to the total outstanding loans is much lower, at 2/565 or 0.35%. This is a dramatic decrease from our most recent analysis, which calculated 1.54% of outstanding loans falling into REO status.
Many of our investors have asked about the impact that the ten loans financed on East Barcelona Way might have on these repayment metrics. The total principal invested in all ten of these loans is close to $2 million (approximately 2% of our outstanding portfolio), and as such, the ultimate resolution of these loans will have an effect on our repayment performance metrics. They are currently included in the default loan totals in the Active Portfolio table. Even with the Barcelona loans included, the default rate of the outstanding portfolio is under 6% and the estimated loss ratio would still be less than 3.0%.
If we were to extrapolate the effect of a 100% loss on all ten Barcelona loans, principal returned would still be almost 90% for all loans in default, and 97% across all loans, regardless of performance state. Additionally, if the Barcelona properties experienced a total loss, the loss ratio for all loans would be just 3% -- in other words, the total principal that was lost would account for only 3% of the total principal invested to date. This is another great example of just how powerful diversification can be for investors’ portfolios. Spreading out funds over multiple investments can help mitigate the damage a major loss such as this hypothetical one could do.
Conclusion
As the saying goes, lending out money is easier than getting it back. Growth in volume can come at the cost of quality. The data shows this hasn't been the case for Groundfloor. Indeed, our performance has improved significantly over time while the company doubled the number of loans closed year over year (see our Q2 results for more details). The fact that we are originating and offering more loans than ever before to a rapidly growing investor base, while simultaneously reducing the rate of loans falling into default and REO status, speaks to our commitment to providing quality products for our customers.
The reductions in our default and foreclosure rate in both our repaid and outstanding portfolios are due to our continued investment in systems, processes, and people to scale our risk and asset management capabilities. We have also been working to increase our repeat business, which allows us to pursue new projects with reliable and proven borrowers. We are proud to see that the data shows our efforts are paying off, which translates to a better overall experience for our borrowers and investors.
Over six years ago, Groundfloor was founded to enable everyday Americans to invest in high-yield securities previously reserved for the top 5% of wealth holders and income earners. As Groundfloor continues to expand its loan origination capabilities, the degree to which our investors can diversify their portfolios has become unprecedented in the real estate investment space. In line with our mission, we will continue to empower our investors to develop and execute their own investment strategies. Whether and how you take full advantage of this degree of freedom is up to you.


