
To provide a more useful supplement to our recent "Monthly Market Trends" February Blog and following feedback we've received, we are taking a closer look at Atlanta's 12 core counties to provide more comprehensive insight for each one.
The Atlanta real estate market has experienced significant population growth in recent years, leading to increased demand for homes. The Atlanta area offers a variety of housing options, from historic homes in the city to new developments in the suburbs, which appeals to a range of homebuyers.
Here is a snapshot of the overall Market Activity for the 12 core Atlanta MSA counties provided by Georgia MLS ("GAMLS".)

Notable in the snapshot to me is that Median Sales Price was up 2.3%. The inventory increase of 74% pops the eyes a little, doesn’t it? But we have to keep in mind the historical low level that inventory was showing in January of 22.
The question on our minds today and subject of this market trends update is to look at the Atlanta market data in detail to gain understanding on how the seasonal Spring market may be setting up and ultimately unfold.
Spring is often regarded as the peak season of activity in the housing market. Thanks to the milder climate and longer daylight hours, it's an ideal environment for buying or selling homes. Many people take advantage of the spring season to make a move, resulting in an increase in the number of homes for sale and a higher level of competition among buyers. During this time, it's not uncommon for homes to receive multiple offers and for bidding wars to occur. The spring real estate market can be a great opportunity for sellers to capitalize on the increased demand, which is fantastic for our borrowers nearing the end of their projects and are ready to sell or who have had to hold on thru the past couple of months to optimize sales proceeds.
Let’s look at the data!
Purchase mortgage applications indicate an increase in housing demand. Over the past few weeks, purchase applications have consistently trended upwards, a sign that the Spring market is taking off. This could result in more closed home sales within the next 60 to 90 days - the peak of the Spring season.

Updated Weekly Mortgage Applications
This mortgage application demand data, though originating from a nationwide source, can be taken as representative for metro areas such as Atlanta and other regions where Groundfloor lends.
Let’s take a look at the expanded view of 12 Atlanta's core counties.
First, we are going to utilize the Market Action Index provided by Altos Research.
This Market Action Index answers “How’s the Market?” by comparing the rate of sales versus inventory. Based on a score of 1 to 100, we note that 30 and below represent a “Buyer’s Market” and above 30 represents a “Sellers Market.”
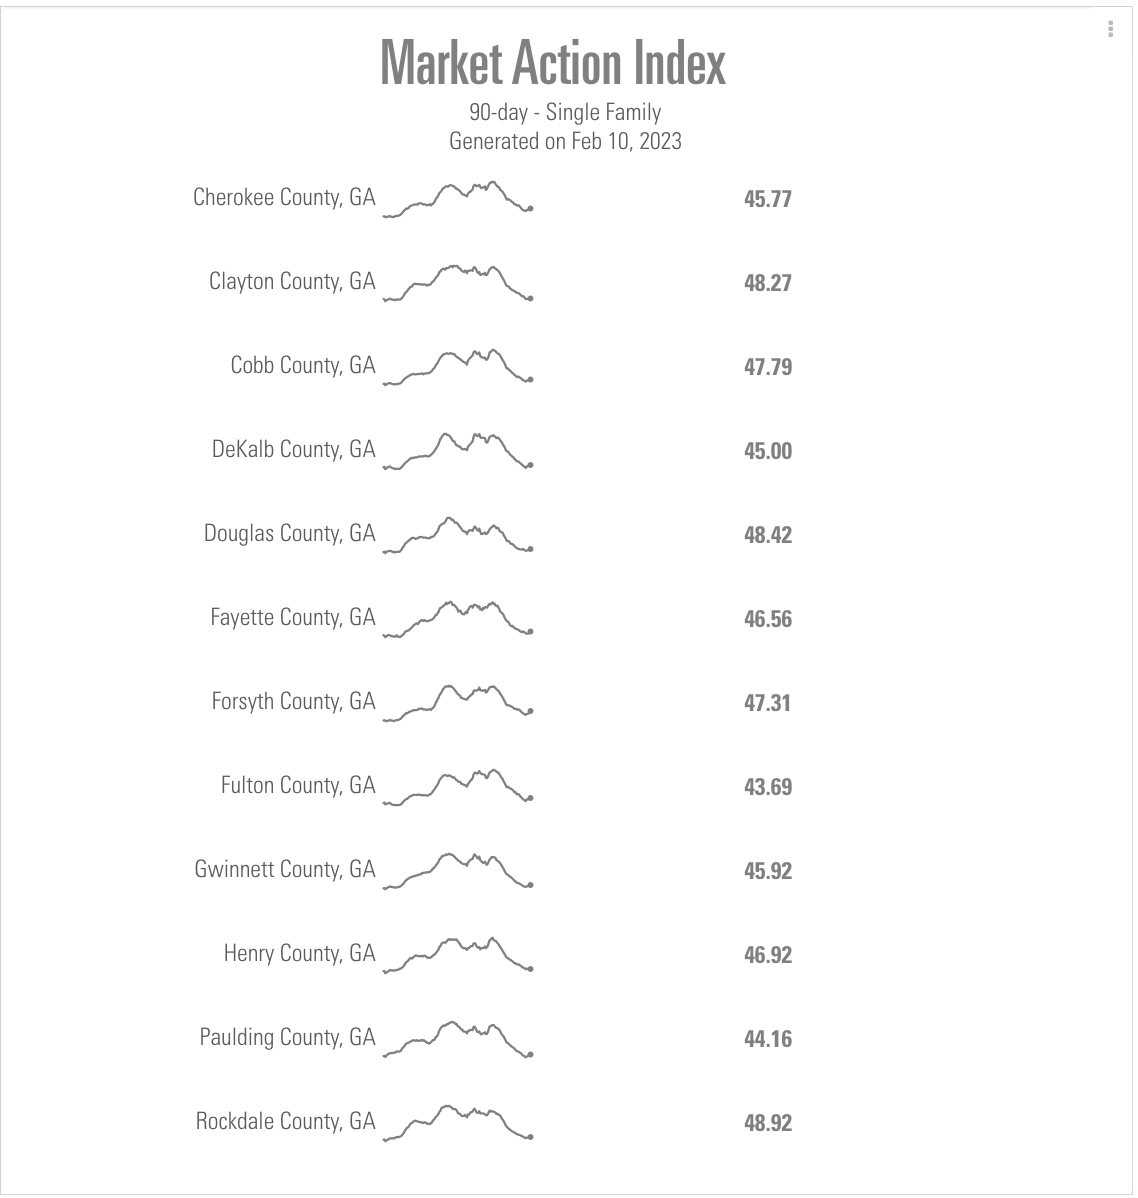
Expanded Core Counties Atlanta, Market Action Index
Scores range from 48 in Clayton County to 43 in Fulton County. Sellers have an advantage if a score is above 30, as indicated by the sparkline representing the 90-day trajectory.
Each county initially showed movement towards a buyers market, then reversed over the last 30 days with the trajectory favoring more movement on the sellers side. It's too early to be sure exactly what this means, but it's clear that sellers certainly have options while buyers have access to a better market than previously. There is no indication of a crashing market related to prices.
How are sellers behaving? To answer this, a good indicator to reference is what percentage of listings have had price decreases. A high percentage of decreases would indicate that sellers are capitulating and prices are under pressure, while fewer decreases or a declining number suggest that they have competitive offers to consider.
Let’s take a closer look at Atlanta's expanded core counties in relation to percentage price decreases:

In the last 45 days, the rate of price decreases in each expanded core county has decreased more than before. The national average for price decreases is at 34%, whereas these counties referenced above have higher percentages. However, the trend shows that prices are not declining as rapidly; this could be a sign that prices are stabilizing.
Inventory spiking in this time of year would clearly indicate problems within the market as the seasonal trend for this time of year tends to show inventory decreasing ahead of an increase of inventory in Spring. We see that the typical seasonal trend is in line, regarding inventory; however, the inventory is near historic lows. The expanded core Atlanta counties all show a recent decrease in inventory, as we would usually expect for this time of year.

A positive sign for buyers can be found by reviewing the median list price data. Each expanded core Atlanta county is showing a lower Median list price. Since affordability is a key concern, a lower median price with recent reductions in mortgage rates could be a very positive sign for buyers.

Currently, Groundfloor has 38% of its loan volume in the 12 expanded core counties of Atlanta. Given the market data we have reviewed here, we anticipate a more active Spring market than perhaps was envisioned a quarter or two ago.
The Atlanta market health is important to our investors getting repaid, and our borrowers finding good quality transactions for us to lend. The data we've gathered so far has been promising and we will continue to track any changes or new developments closely.
