
In this Monthly Market Trends series, we'll continue to offer you our interpretation of current trends through the eyes of our VP of Market Risk, Patrick Donoghue, and provide you with his balanced commentary so you can make the best investment decisions today, for the highest returns tomorrow.
May was an anxiety ridden month as the debt ceiling deadline loomed and the debate sent prognostications of severe catastrophe in financial markets screaming across headlines. As usual, though, in this long standing goat parade, a deal was struck and crisis averted.
When I wasn’t downing tums and taking worried walks in my neighborhood - I couldn’t help but notice what was happening in the new construction market. This is a market Groundfloor watches closely as nearly a quarter of the loans we make are to help independent developers build new homes and sometimes even small townhouse developments.
The index to watch for builder sentiment is the NAHB Housing Market Index.
The National Association of Home Builders (NAHB) Housing Market Index (HMI) is a monthly survey that measures builder sentiment about the current state and future prospects of the U.S. single-family housing market. It is considered a leading indicator of housing market conditions and provides insight into the outlook for new home construction.
The NAHB HMI is based on a scale from 0 to 100, where a reading above 50 indicates positive sentiment among home builders. A score below 50 suggests that builders are pessimistic about the market conditions. The index is composed of three components: current sales conditions, sales expectations for the next six months, and buyer traffic.
Higher readings on the HMI indicate that more builders view market conditions as favorable. It reflects their perception of current home sales, expected future sales, and the foot traffic of prospective buyers. The index is calculated by taking the seasonally adjusted average of the three components.
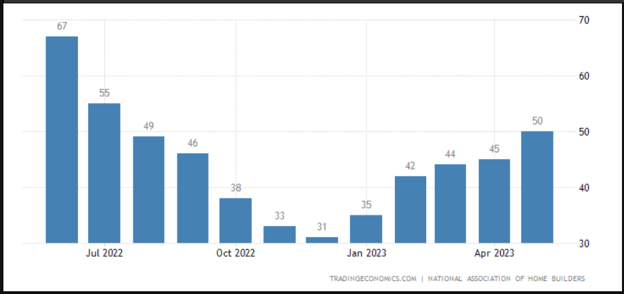
We first note the steep decline from June 2022 (67) to the low point of (31) in December 22. If you track large builder stocks you really saw pain there as well. But! From the beginning of this year the index rose impressively from the low of 31 to recover back to 50, which is the index benchmark of overall positive builder sentiment. And, again, if you track builder stocks you have already seen the sharp recovery.
Fortune Notes that “Our theme of Housing Stocks, which includes the stocks of home builders, building products companies, and home improvement players, has fared relatively well thus far in 2023, rising by about 16% year-to-date. This compares to the S&P 500 which remains up by about 6% over the same period.”
Groundfloor continued to fund new construction loans throughout 2022 and will continue to do so for the foreseeable future. If larger builders go on pause, our more agile independent builders can benefit as lots become more reasonably bid and there could be a future lack of available new homes as current inventories are sold through. New & renovated homes, especially starter homes, in supply constrained markets are highly sought after.
In the below chart you can see how over the past 14 months new home starts stalled as well as requests for building permits. Both track that larger builders pulled back and worked through their current inventory.
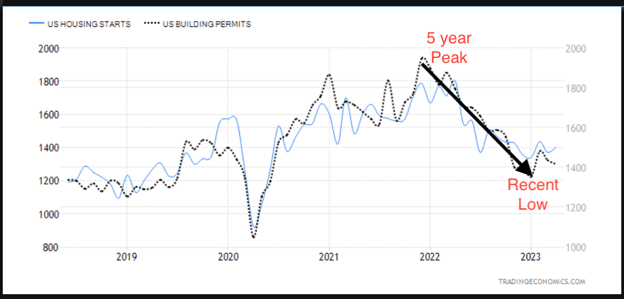
It’s certainly a positive that New Construction has re-ignited. Moreover, it's certainly a positive that Groundfloor borrowers continue to deliver newly renovated homes as well. Nationally, the housing market continues to be severely constrained and if we want to identify a crisis, it’s in inventory. This is the opposite of the 2008 market which was a true debacle of over-supply lead price decline. That is not what is currently happening.
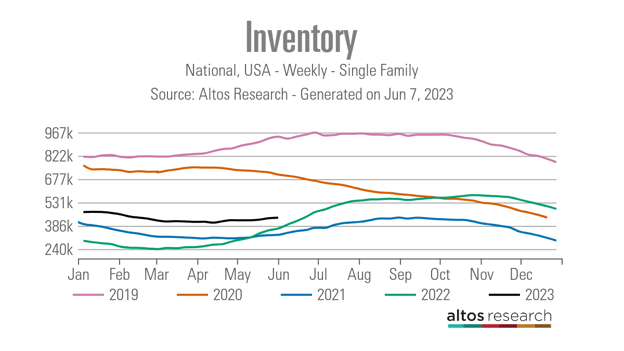
The black line above represents current housing inventory (436,284). Though inventory is slightly higher than 2021 at this time - these numbers are historically low. In contrast, in 2019 inventory at this point in the year was 941,430. In other words, current housing inventory is only at 46% of the number of homes that were for sale at this time in 2019.
For a more historical reference, below is the 2023 current inventory compared to the inventory in 2013 through 2019 at the same point of the year.

On May 30, 2023, the FHFA released its House Price Index (HPI) report for Q1 2023. I track this index closely because of the way the data is gathered. The FHFA HPI index uses appraisal data gathered from the agencies (Fannie and Freddie) a main data source .
About the FHFA HPI index:
“The FHFA HPI is a comprehensive collection of public, freely available house price indexes that measure changes in single-family home values based on data that extend back to the mid-1970s from all 50 states and over 400 American cities. It incorporates tens of millions of home sales and offers insights about house price fluctuations at the national, census division, state, metro area, county, ZIP code, and census tract levels. FHFA uses a fully transparent methodology based upon a weighted, repeat-sales statistical technique to analyze house price transaction data.” - source FHFA
The significant findings for Q1 2023 were summarized this way:
- Nationally, the U.S. Housing market experienced positive annual appreciation each quarter since the start of 2012.
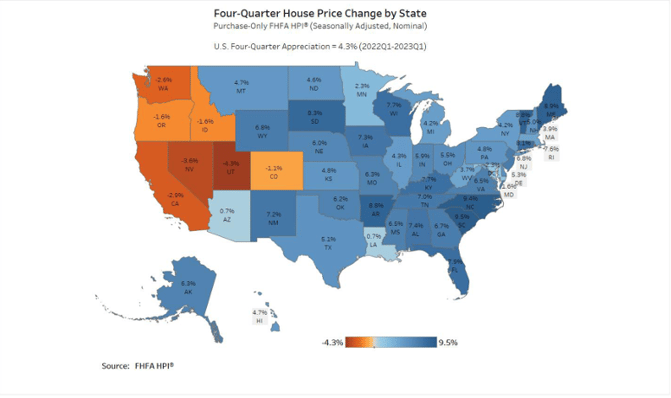
- House prices rose in 43 states between the first quarters of 2022 and 2023. The five areas with the highest annual appreciation were 1) South Carolina, 9.5 percent; 2) North Carolina, 9.4 percent; 3) Maine, 8.9 percent; 4) Vermont, 8.8 percent; and 5)Arkansas, 8.8 percent. The areas showing the highest annual depreciation were 1) Utah, -4.3 percent; 2) Nevada, -3.6 percent; 3) California, -2.9 percent; 4) Washington, -2.6 percent; and 5) District of Columbia, -2.3 percent.
- House prices rose in 78 of the top 100 largest metropolitan areas over the last four quarters. The annual price increase was greatest in Miami-Miami Beach-Kendall, FL at 14.1 percent. The metropolitan area that experienced the greatest price decline was San Francisco-San Mateo-Redwood City, CA (MSAD) at -10.1 percent. •
- Of the seven census divisions with positive house price changes, the South Atlantic division recorded the strongest four-quarter appreciation, posting a 7.2 percent increase between the first quarters of 2022 and 2023. House prices depreciated in two census divisions. The annual house price decreased by 2.4 percent in the Pacific division and by 0.1 percent in the Mountain division.
Once again the South Atlantic division had the best overall performance. No region where Groundfloor has a significant exposure in our lending portfolio experienced annual price decreases, as measured by this Index. In key Groundfloor states, like Georgia and Florida, appreciation continued to stay positive. Both states performed better than the national overall figure of 4.3%, with Florida coming in at 7.9% and Georgia at 6.7%.
Here is a quick look nationally for the Four-Quarter House Price Change by State:
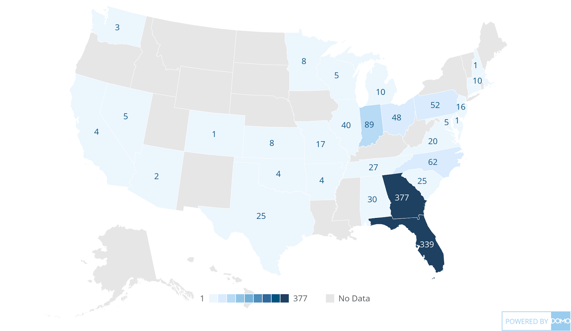
And, Groundfloor loan unit exposure by state:
Who is in control of the market nationally, buyers or sellers? You would think that with interest rates nearly twice as high as they were a year ago, and all of the perceived turmoil over the last year, that clearly buyers would be in control and prices would be plummeting nationally. This isn’t true, according to the metric we watch published by Altos Research, the Market Action Index suggests that based on the rate of sales vs. inventory - sellers maintain control over the current market.
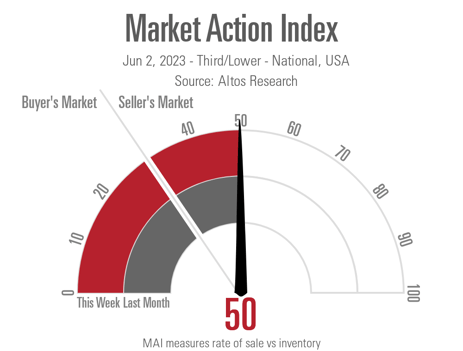
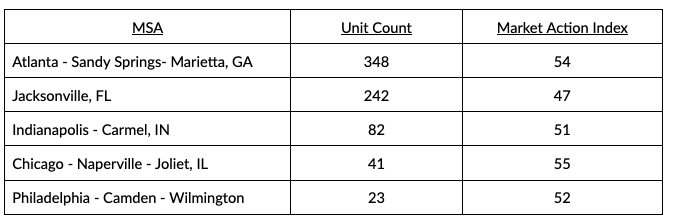
If we drill down to some of Groundfloor's most active MSA’s this trend holds true (a score above 30 represents a seller's market):
We remain committed to supporting our borrowers as the housing picture unfolds by continuing to offer renovation and construction loans, allowing them to contribute to the supply of homes amidst the current inventory crisis. At the same time, our investors will continue to reap the benefits of the successful completion of these projects.
If you have suggestions for future market trend blogs please feel free to leave a comment!
