
In this Monthly Market Trends series, we offer you our interpretation of current trends through the eyes of our VP of Market Risk, Patrick Donoghue, and provide you with his balanced commentary so you can make the best investment decisions today for the highest returns tomorrow.
Reviewing 2023
We've successfully reached the end of 2023.
As we approach the close of 2023 and prepare to enter a new year in the housing market, it's crucial to examine the macroeconomic events of the past year. This review will provide us with insights into the trends and factors that have shaped the housing market, allowing us to make informed predictions about what to expect in the housing market for 2024. In this post, we will take a retrospective look at 2023, and in our January 2024 post, we will discuss our expectations for the market moving forward.
Sustained Higher Interest Rates Induced Inflation to Recede in 2023.
The Core PCE, the Fed’s preferred gauge of inflation, fell consistently all year. In January 2023, the Core PCE was 4.90% and by October had fallen to 3.463%.

Core PCE started to rise significantly at the onset of the pandemic and continued its upward trend until around March 2022. We all experienced the effects of this inflationary period, as goods and services became both harder to obtain and more expensive.
However, since that peak in March 2022, we have witnessed a welcome relief, even though it has come with its share of challenges. From January 2023 up to the present, there has been a notable 37% decline in Core PCE, which serves as a clear indicator of the progress being made in the fight against inflation.
The US (general) inflation rate is ending the year below 4%, off its peak high of 9% in June of 2022. So, a 9% peak to the current reading of 3.1% (black arrow on chart below) is a 65% reduction. This is another positive sign of progress and another indication that a soft landing, while hard to believe, is possible.

Core PCE and the Inflation Rate are normalizing, which will affect interest rates. We saw in 2023 that the Feds tightening reduced key inflation measures. Ashok Varadhan, the Co-Head of Global Banking & Markets for Goldman Sachs, commented on interest rate normalization the following way back in September of 2023 during his interview on “Goldman Sachs Exchanges: The Markets”:
“I think when you look at interest rates and you look at how much normalization has taken place over the course of the last two years, you've had 525 basis points of rate hikes. And that's a pretty dramatic thing. And so, obviously, that's a policy that's been undertaken in an attempt to bring inflation back down to 2 percent. They've made a lot of progress. Inflation has basically gone from 8 percent at this time last year to now tracking at about 3 percent currently with some contemporaneous readings which show us at, like, in the low twos at the margin. And so, I think what the market is saying is, okay, that is somewhat cyclical as opposed to structural. We think that over the course of the next couple years when the Fed does ultimately succeed and bring inflation down into the twos, they'll be able to lower rates back to a more neutral, long-term rate, which the market approximates as being somewhere around 3.5 percent.”
It's intriguing to assert that the normalization process is cyclical rather than structural, and I agree with this perspective. If we examine it from a statistical angle, considering mean reversion applied to US inflation over a longer period, like 5 years, the cyclical patterns become more evident. It's worth noting that while extreme volatility, both high and low, was triggered by a non-cyclical catalyst, we can observe a return to the mean in the data.

For clarity “mean reversion” can be defined as below:
"Reversion to the mean, also known as mean reversion, is a statistical concept that suggests that over time, data points tend to move towards the average or mean value. In other words, if a data point is unusually high or low compared to the historical average, it is likely to move back towards that average in the future. This concept is often applied in various fields, including finance, investing, and sports statistics."
As investors in products like Groundfloor’s LROs, how can we use concepts like mean reversion as they unfold in cyclical economic forces like inflation? If we consider that the mean on a 5-year view for inflation is around 4%, a good question may be, "How do we guard our dollars against the cycles which flare above the mean?" And conversely, "How do we maximize our dollar value when cycles fall significantly below the mean?"
I think the answer is: consistency along with a spice of prudence. While I acknowledge my bias, I firmly believe that the Groundfloor LRO, a cornerstone investment within the Groundfloor investment ecosystem, presents an exceptional opportunity to safeguard and maximize the value of your dollar as we navigate the cyclic nature of inflation. We cannot predict the future with certainty, but we can reasonably rely on the occurrence of future economic cycles. The good news is that you don't need to engage in the challenging task of timing market bottoms and tops, which often leads to long-term losses. Instead, consistent investing, a deep understanding of your investments, and their alignment with the inevitable economic cycles offer a practical and reliable path to outperform the crowd
Let’s look at our 5-year chart of inflation again that has the designated mean and rounded arrows that depict the mean reversion and let’s add the historical return of the Groundfloor LRO, which today is about 9.74%.

In my view, this confirms the idea that real estate investing, in general, serves as a safeguard or hedge against inflation. Typically associated with direct property investments, I don't see why this wouldn't also apply to our innovative LRO investment, which involves short-term, high-yield debt instruments backed by residential, single-family properties.
The underlying principle here is that over time, a well-diversified portfolio of LROs should outperform inflation. Furthermore, I believe that LROs offer a superior risk-adjusted return when compared to other common strategies used to counter inflation, such as commodities or bond indexes. I have provided a table of supporting data for this concept below:
9 Asset Classes for Protection Against Inflation + Groundfloor LRO
Table of Investments — Return Comparisons (5 years)
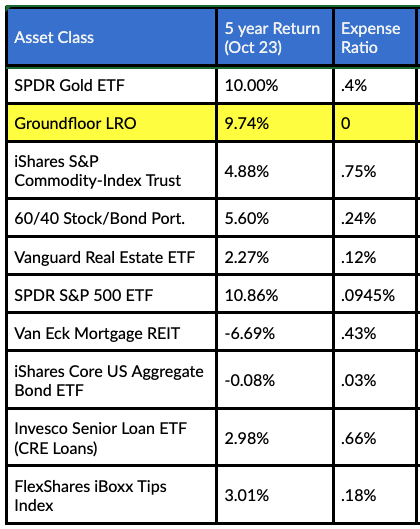
(Source Investopedia)
Note: If you've noticed that we're using a longer historical dataset for LRO returns compared to the 5-year returns for other asset classes, I believe this choice is justified. The rationale behind it is that a significant majority of our total origination has taken place in the past 5 years.
I built this table to show the overall effectiveness of high-yield, short-term debt as it relates to other inflationary protective assets. Only Gold and Equities (S&P) marginally outperformed Groundfloor LRO’s.
Let’s draw back to the intent of the post, a review of 2023. I want to express that you cannot do that without understanding the effect of inflation on investments. Over this periodic inflationary time, the Groundfloor LRO maintained advantageous and protective returns when compared to the radical rise of inflation. 2023 was a year where this otherwise newer investment vehicle showed up (compared to say gold, for instance).
Examining the Current National Housing Market
Taking a closer look at the current state of the national housing market, we observe that the "Median List Price" over the past ninety days, as indicated by the sparkline, has declined to $424,900. It's worth noting that this decline aligns with seasonal trends and falls within the expected range.
Additionally, the occurrence of price decreases currently stands at 38%, which is slightly higher than the long-term historical average of 33%. This increase is not surprising, especially in a high-rate environment, as listing prices are more likely to experience reductions.
Overall, the nation’s housing sellers hold the advantage and have all year.

Now let’s compare these metrics to one year ago (December 2022). We see that the market pretty much held serve. We did not see a national crash of home prices; in fact in many areas like the midwest and the south we observed the opposite, price appreciation on a year over year basis. Here are the charts for several key metrics to understand 2023.
Seller vs Buyer Market (The Market Action Index) 1 year

Median Days on Market — 1 year
Median DOM has fallen from 70 to 63

Price Decreases % — 1 year
Held range and ended below where we began

Inventory — Historical Year-over-Year
Still well below Pre-Pandemic levels

House Price Appreciation (FHFA) — HPA decelerated. Did not crash.

Interest Rates
This week, Chairman Powell decided to keep the Fed Funds rate unchanged, but he adopted a more dovish tone regarding future interest rate increases, suggesting the possibility of as many as three interest rate decreases in 2024, according to some interpretations. This news was well-received by the markets, leading to a rally. It's also positive news for the ongoing affordability challenges in the housing market.
When interest rates are lowered, and if the 10-year treasury rate continues its downward trajectory, the 30-year mortgage rate typically follows suit. In the past 30 to 45 days alone, we have seen the 30-year mortgage rate drop from slightly above 8% to 6.8% at the time of this post. Furthermore, additional relief can be expected as the gap between the mortgage rate and the ten-year treasury rate returns to more historical levels.
Historically, this "spread" between 10-year treasuries and 30-year mortgages has been at 1.5%, while recently it has persistently been at 3%. As inflation and the Fed Funds rate normalize, both the bond market and providers of 30-year mortgage debt are unlikely to require such a high premium over the historical spread. When this spread retraces to the average of 1.5%, it will narrow the affordability gap, even if the 10-year treasury rate remains unchanged.
Affordability started to improve in the fourth quarter of 2023, and we expect to see more of this positive trend as we progress through 2024.
Bond Market Rally — 10 Year Treasury Yield decrease.

Interest rate traders see the Fed Decision landscape this way in 2024.

Participants in this market have bet against any probability of a rate hike in 2024. In fact, the probability of “easing” has risen to 76% as early as March 2024 and increases to 100% by September 2024. Pretty incredible, considering the haunting mantra of “Higher for Longer” has taunted onlookers throughout 2023.
And finally, jobs. Though some pressure on employment showed up in 2023, the US remains gainfully employed. Here is the unemployment rate monthly for 2023:

I hope that you have a restful holiday season. 2024 is shaping up to be an interesting year in housing and in the overall economy as a whole. I look forward to sharing my thoughts on the year to come in the January post. Until then, keep investing.
