
Welcome to the latest installment of our Portfolio Analysis, a series we began in January 2018.
This report is part of a suite of recurring analyses - including our Diversification Analysis, our analysis of LRO Performance by Grade, and our monthly Asset Management updates - that we provide to our investors to shed light on the status and performance of Groundfloor investments. Unlike the Diversification and Performance by Grade analyses, however, which report directly on the performance of LROs offered on our platform, this Portfolio Analysis reports on the loan assets backing all investments we offer, whether LROs, Groundfloor Notes, or Stairs. The purpose of the report is to provide you with further insight into our lending activity, loan repayment outcomes, and the size and shape of our portfolio of loans outstanding currently.
Lending Activity
For this analysis, we group our loans into “cohorts” according to the year in which they were originated:
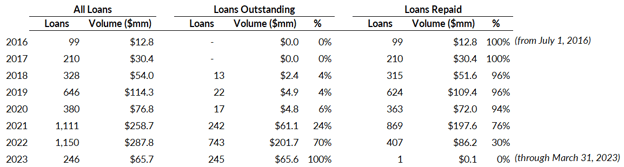
As the chart shows, 100% of the loans we originated prior to 2018 have been resolved. And, out of 1,354 loans we originated in 2018-2020, only 52 remain outstanding. Many loans in those cohorts were adversely impacted by the economic repercussions of COVID-19; we have worked tirelessly to bring those loans to resolution, and will continue to do so until all those loans have been resolved in a manner optimal for our investors.
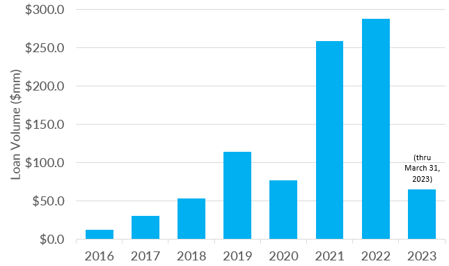
In 2021, we expanded our lending significantly, supported by a stabilized economy and strong demand from our investors, and 2022 was a record year for loan originations.
So far in 2023, through March 31, we have originated 246 loans for $65.7 million in volume.
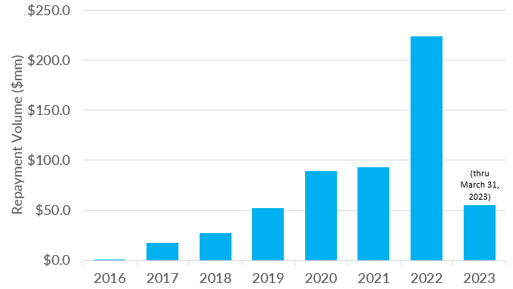
Repaid Loans (July 1, 2016 to March 31, 2023)
As shown in the graph below, 2022 was a record not just for loan originations, but for loan repayments as well, and 2023 is off to a strong start.
Experienced investors on our platform know there are many paths to recovery of a loan. Some loans will repay before the end of their contractual terms, through a successful home sale or refinance (a performance state we refer to as “Performing”). Other loans may require an extension, to allow time for work to complete or for sale and refinance transactions to close (“Extended”). Still others go into default, and our recovery on those may be realized through a number of avenues, including foreclosure (“Default”). Because of Groundfloor’s security interest in the underlying properties, all of these paths to recovery can result in successful outcomes from an investment perspective.
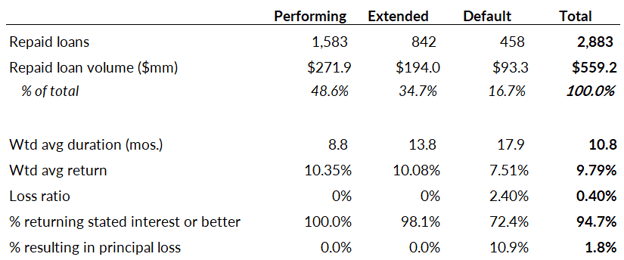
Looking at all 2,883 loans that have repaid through March 31, 2023, we find that 48.6% of those loans repaid from a performance state of Performing, 34.7% from Extended, and 16.7% from Default.
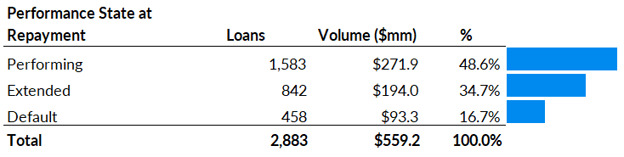
Critically, though, we must also look at how these performance states have translated into investment outcomes. And here is what we find when we do that:
- Globally, 94.7% of loans (by volume) have resulted in a full recovery of principal plus interest at the contracted rate or better
- Our portfolio’s loss ratio (realized losses as a percentage of loan volume) across these repaid loans has been only 0.40%, with 1.8% of loans (by volume) resulting in some loss of principal
- While repayments from a Default state have accounted for 16.7% of repayment volume, those defaulted loans have collectively resulted in a positive weighted average interest return of 7.51%
- Over this time period, 72.4% of loans repaid from a state of Default have resulted in a full return of principal plus interest at the contracted rate or better; 10.9% have resulted in some loss of principal; and the loss ratio on these defaulted loans has been 2.40%
Here are some more performance statistics on repaid loans, according to the performance state of those loans at the time of recovery:
Active Loans as of March 31, 2023
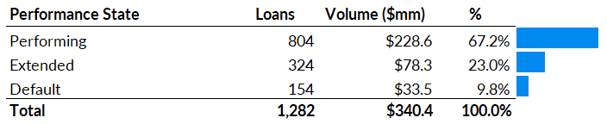
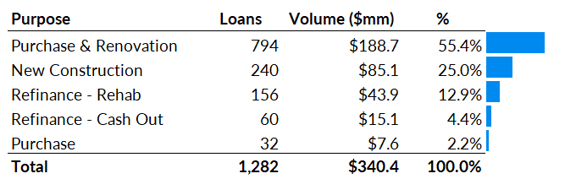
As of March 31, 2023, we had 1,282 loans currently outstanding for a total volume of $340.4 million. Here is how those loans break down according to performance state:
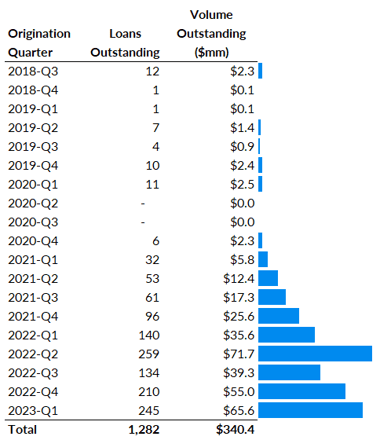
From an aging standpoint, 78.5% of our active portfolio was originated in 2022 or later; 96.4% was originated in 2021 or later. The distribution is represented visually in the chart below. As we noted previously, small numbers of loans from pre-2021 remain outstanding, and our Asset Management team is working daily to achieve optimal resolutions on those loans.
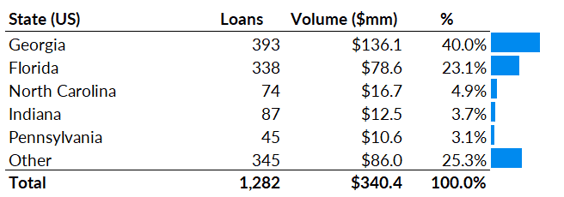
Geographically, we have active loans in 30 U.S. states. Our greatest concentration of loans is in the Southeast, with Georgia and Florida leading the way.
Finally, a breakdown of our active loans according to “purpose,” or the expected use of loan proceeds by the borrower. As shown, the most common purpose of our loans has been to purchase and renovate a property; second most common is to pursue a new construction.
Conclusion
We trust you found this analysis informative as we continue to provide commentary and insight into the performance of our loan portfolio in an effort to aid your investment decisions.
If you have any questions or comments about this report, do not hesitate to reach out to us. You can comment below or send an email to support@groundfloor.us. We always look forward to hearing from you.
